In December 2015, the total profits of industrial enterprises above designated size reached 816.72 billion yuan, down 4.7% year-on-year, and the decline was 3.3 percentage points higher than that in November.
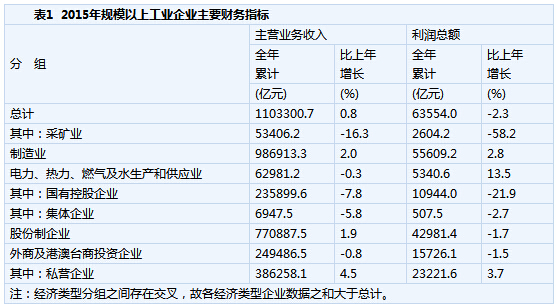
Among the industrial enterprises above designated size, the state-owned holding enterprises realized a total profit of 1,094.4 billion yuan in 2015, down 21.9% from the previous year; collective enterprises realized a total profit of 50.75 billion yuan, down 2.7%; the joint-stock enterprises realized a total profit of 4,298.14 billion yuan, down 1.7%. Foreign-invested enterprises, Hong Kong, Macao and Taiwanese investment enterprises realized a total profit of 157.21 billion yuan, down 1.5%; private enterprises realized a total profit of 2322.16 billion yuan, an increase of 3.7%.
In 2015, the mining industry realized a total profit of 260.42 billion yuan, a decrease of 58.2% over the previous year; the manufacturing industry realized a total profit of 560.92 billion yuan, an increase of 2.8%; the electricity, heat, gas and water production and supply industries realized a total profit of 534.06 billion yuan. Growth of 13.5%.
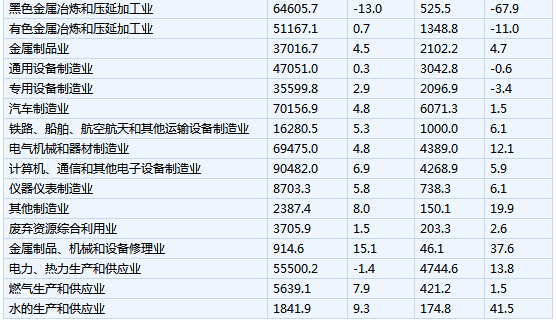
In 2015, among the 41 major industrial sectors, the total profit of 29 industries increased compared with the previous year, and 12 industries declined. Major industry profit growth: total profit of agricultural and sideline food processing industry increased by 6.4% over the previous year, textile industry increased by 5.1%, petroleum processing, coking and nuclear fuel processing industry increased by 9.7 times, chemical raw materials and chemical products manufacturing increased by 7.7%, automobile The manufacturing industry grew by 1.5%, the electrical machinery and equipment manufacturing industry grew by 12.1%, the computer, communications and other electronic equipment manufacturing industries increased by 5.9%, the electricity, heat production and supply industries increased by 13.8%, and the coal mining and washing industry fell by 65%. The oil and gas exploration industry fell 74.5%, the non-metallic mineral products industry fell 9%, the ferrous metal smelting and rolling processing industry fell 67.9%, the non-ferrous metal smelting and rolling processing industry fell 11%, the general equipment manufacturing industry fell 0.6%, special equipment Manufacturing fell by 3.4%.
In 2015, the industrial enterprises above designated size achieved a revenue of 110,330.07 billion yuan, an increase of 0.8% over the previous year; the cost of the main business was 945,35.92 billion yuan, an increase of 0.8%.
At the end of 2015, the assets of industrial enterprises above designated size totaled 99,974.11 billion yuan, an increase of 6.9% over the previous year; the total liabilities were 5.6156 billion yuan, an increase of 5.6%; the total owner's equity was 438.18 billion yuan, an increase of 8.8%.
At the end of 2015, the accounts receivable of industrial enterprises above designated size were 1,114.69 billion yuan, an increase of 7.9% over the previous year; the inventory of finished products was 3,870.01 billion yuan, an increase of 3.3%.
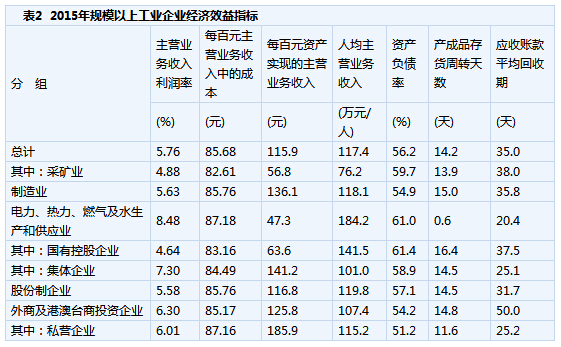
In 2015, the profit rate of the main business of industrial enterprises above designated size was 5.76%, the cost per 100 yuan of main business income was 85.68 yuan, and the main business income realized per 100 yuan of assets was 115.9 yuan, and the per capita main business income. It was 1.174 million yuan, and the inventory turnover days of finished products were 14.2 days. The average payback period of accounts receivable was 35 days. At the end of 2015, the asset-liability ratio was 56.2%.


Bonded Ndfeb Magnets are manufactured by binding rapid-quenching NdFeB powder. The powder is mixed with resin to form a magnet by compression molding with epoxy or infection molding with nylon. Bonded NdFeB magnets are manufactured by binding rapid-quenching NdFeB powder. The powder is mixed with resin to form a magnet by compression molding with epoxy or infection molding with nylon. The latter technique is particular effective in large volume production, though the magnetic value of products is lower than those made with compression molding because of their relatively lower density. Various shapes of high dimensional accuracy can be produced without further processing. Surface is treated by epoxy coating or nickel-plating to prevent corrosion
With different ratio of additives to NdFeB powder, magnetic properties of hybrid NdFeB magnets can be tuned in a wide range. Once the ratio is fixed, magnetic property fluctuation can still be limited in a narrow bank. Hybrid magnets will meet customerˇŻs specified properties.
Rapidly quenched NdFeB powder used for bonded magnets is multi grain with grain size of sub-micron. Powder is isotropic in magnetic properties, which results in flat increasing of remanence and intrinsic coercivity with applied field. Magnet can only be magnetized to saturation in high fields.
| Bonded NdFeB Magnets (Injection Molded) | |||||||||||
| Typical Magnetic Properties | |||||||||||
| Grade | Max. Energy Product | Remanence | Coercive Force | Rev. Temp. Coeff. | Working Temp. | Density | |||||
| (BH)max | Br | Hc | Hci | Bd | Hd | Tc | D | ||||
| MGOe | kJ/m3 | T | kOe | kA/m | kOe | kA/m | %/°C | %/°C | °C | g/cm3 | |
| BNI-2 | 0.8-3.0 | 6.4-24 | 0.2-0.4 | 1.5-3.0 | 120-240 | 7.0-9.0 | 560-720 | -0.15 | -0.4 | 130 | 3.5-4.0 |
| BNI-4 | 3.5-4.5 | 28-36 | 0.4-0.49 | 3.1-3.9 | 247-310 | 7.2-9.2 | 573-732 | -0.1 | -0.4 | 180 | 4.0-5.0 |
| BNI-6 | 5.2-7.0 | 42-56 | 0.49-0.57 | 3.9-4.8 | 312-382 | 8.0-10.0 | 637-796 | -0.1 | -0.4 | 150 | 5.0-5.5 |
| BNI-8 | 7.4-8.4 | 59-67 | 0.57-0.63 | 4.8-5.4 | 382-430 | 8.5-10.5 | 676-835 | -0.1 | -0.4 | 150 | 5.0-5.5 |
| BNI-6H | 5.0-6.5 | 40-52 | 0.48-0.56 | 4.2-5.0 | 334-398 | 13.0-17.0 | 1035-1353 | -0.15 | -0.4 | 180 | 5.0-5.5 |
| Bonded NdFeB Magnets(Compression Bonded) | |||||||||||
| Typical Magnetic Properties | |||||||||||
| Grade | Max. Energy Product | Remanence | Coercive Force | Rev. Temp. | Working Temp. | Density | |||||
| Coeff. | |||||||||||
| (BH)max | Br | Hc | Hci | Bd | Hd | Tw | D | ||||
| MGOe | kJ/m3 | T | kOe | kA/m | kOe | kA/m | %/°C | %/°C | °C | g/cm3 | |
| BNP-6 | 5.0-7.0 | 40-56 | 0.52-0.60 | 3.8-4.5 | 304-360 | 8.0-10 | 640-800 | -0.1 | -0.4 | 140 | 5.3-5.8 |
| BNP-8 | 7.0-9.0 | 56-72 | 0.60-0.65 | 4.5-5.5 | 360-440 | 8.0-12 | 640-960 | -0.1 | -0.4 | 140 | 5.6-6.0 |
| BNP-10 | 9.0-10.0 | 72-80 | 0.65-0.70 | 4.5-5.8 | 360-464 | 8.0-12 | 640-960 | -0.1 | -0.4 | 120 | 5.8-6.1 |
| BNP-12 | 10.0-12.0 | 80-96 | 0.70-0.76 | 5.8-6.0 | 424-480 | 8.0-11 | 640-880 | -0.1 | -0.4 | 130 | 6.0-6.2 |
| BNP-8H | 6.0-9.0 | 48-72 | 0.55-0.62 | 5.0-6.0 | 400-480 | 12.0-16.0 | 960-1280 | -0.07 | -0.4 | 120 | 5.6-6.0 |
Bonded Ndfeb Magnet,Bonded Ndfeb Permanent Magnets,Bonded Industrial Permanent Magnets,Ndfeb Bonded Ring Magnets
Chongqing Great Well Magnet Co.,ltd. , https://www.gwmagnet.com